Versions Compared
Key
- This line was added.
- This line was removed.
- Formatting was changed.
The Delivery Insights page of the Intelligence dashboard provides information into how content is delivered and managed in RAY Enterprise.
Click the Delivery Insights symbol to access the page.
On-time Delivery for Completed Tasks

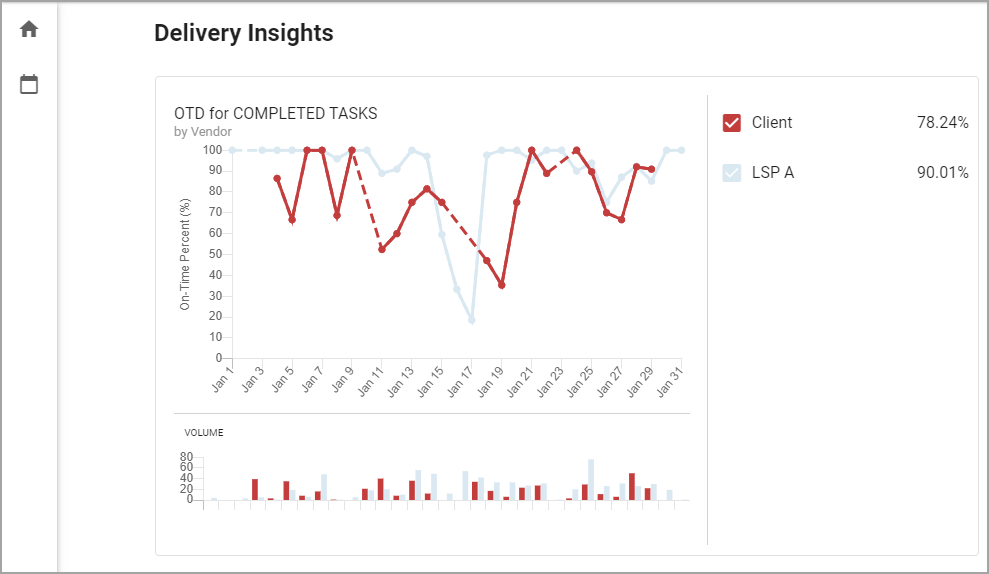
With the OTD for Completed Tasks chart, you can view the percentage of tasks that are completed at a specific time, broken down by vendor.
You’ll also see:
The trend of on-time delivery in the actual chart.
The overall percentage of on-time delivery for your selected time-span for each vendor. This gives an overall “grade” for each vendor for that period of time.
The volume of tasks assigned to each vendor in the sub-chart. Use this to compare changes in on-time delivery with the amount of content assigned to the vendor.
The OTD for Completed Tasks chart only includes human phases that are completed within the time period. Phases that were skipped or canceled are excluded.
Phases that are not assigned to a vendor are tracked against the client organization. This allows you to compare the performance of your LSPs to your own team.
If your phases aren’t consistently getting updates, this chart might not show that much information. Manually setting up phase due dates can be tedious, so It is important to ensure that your workflows are set up with due date configurations.